
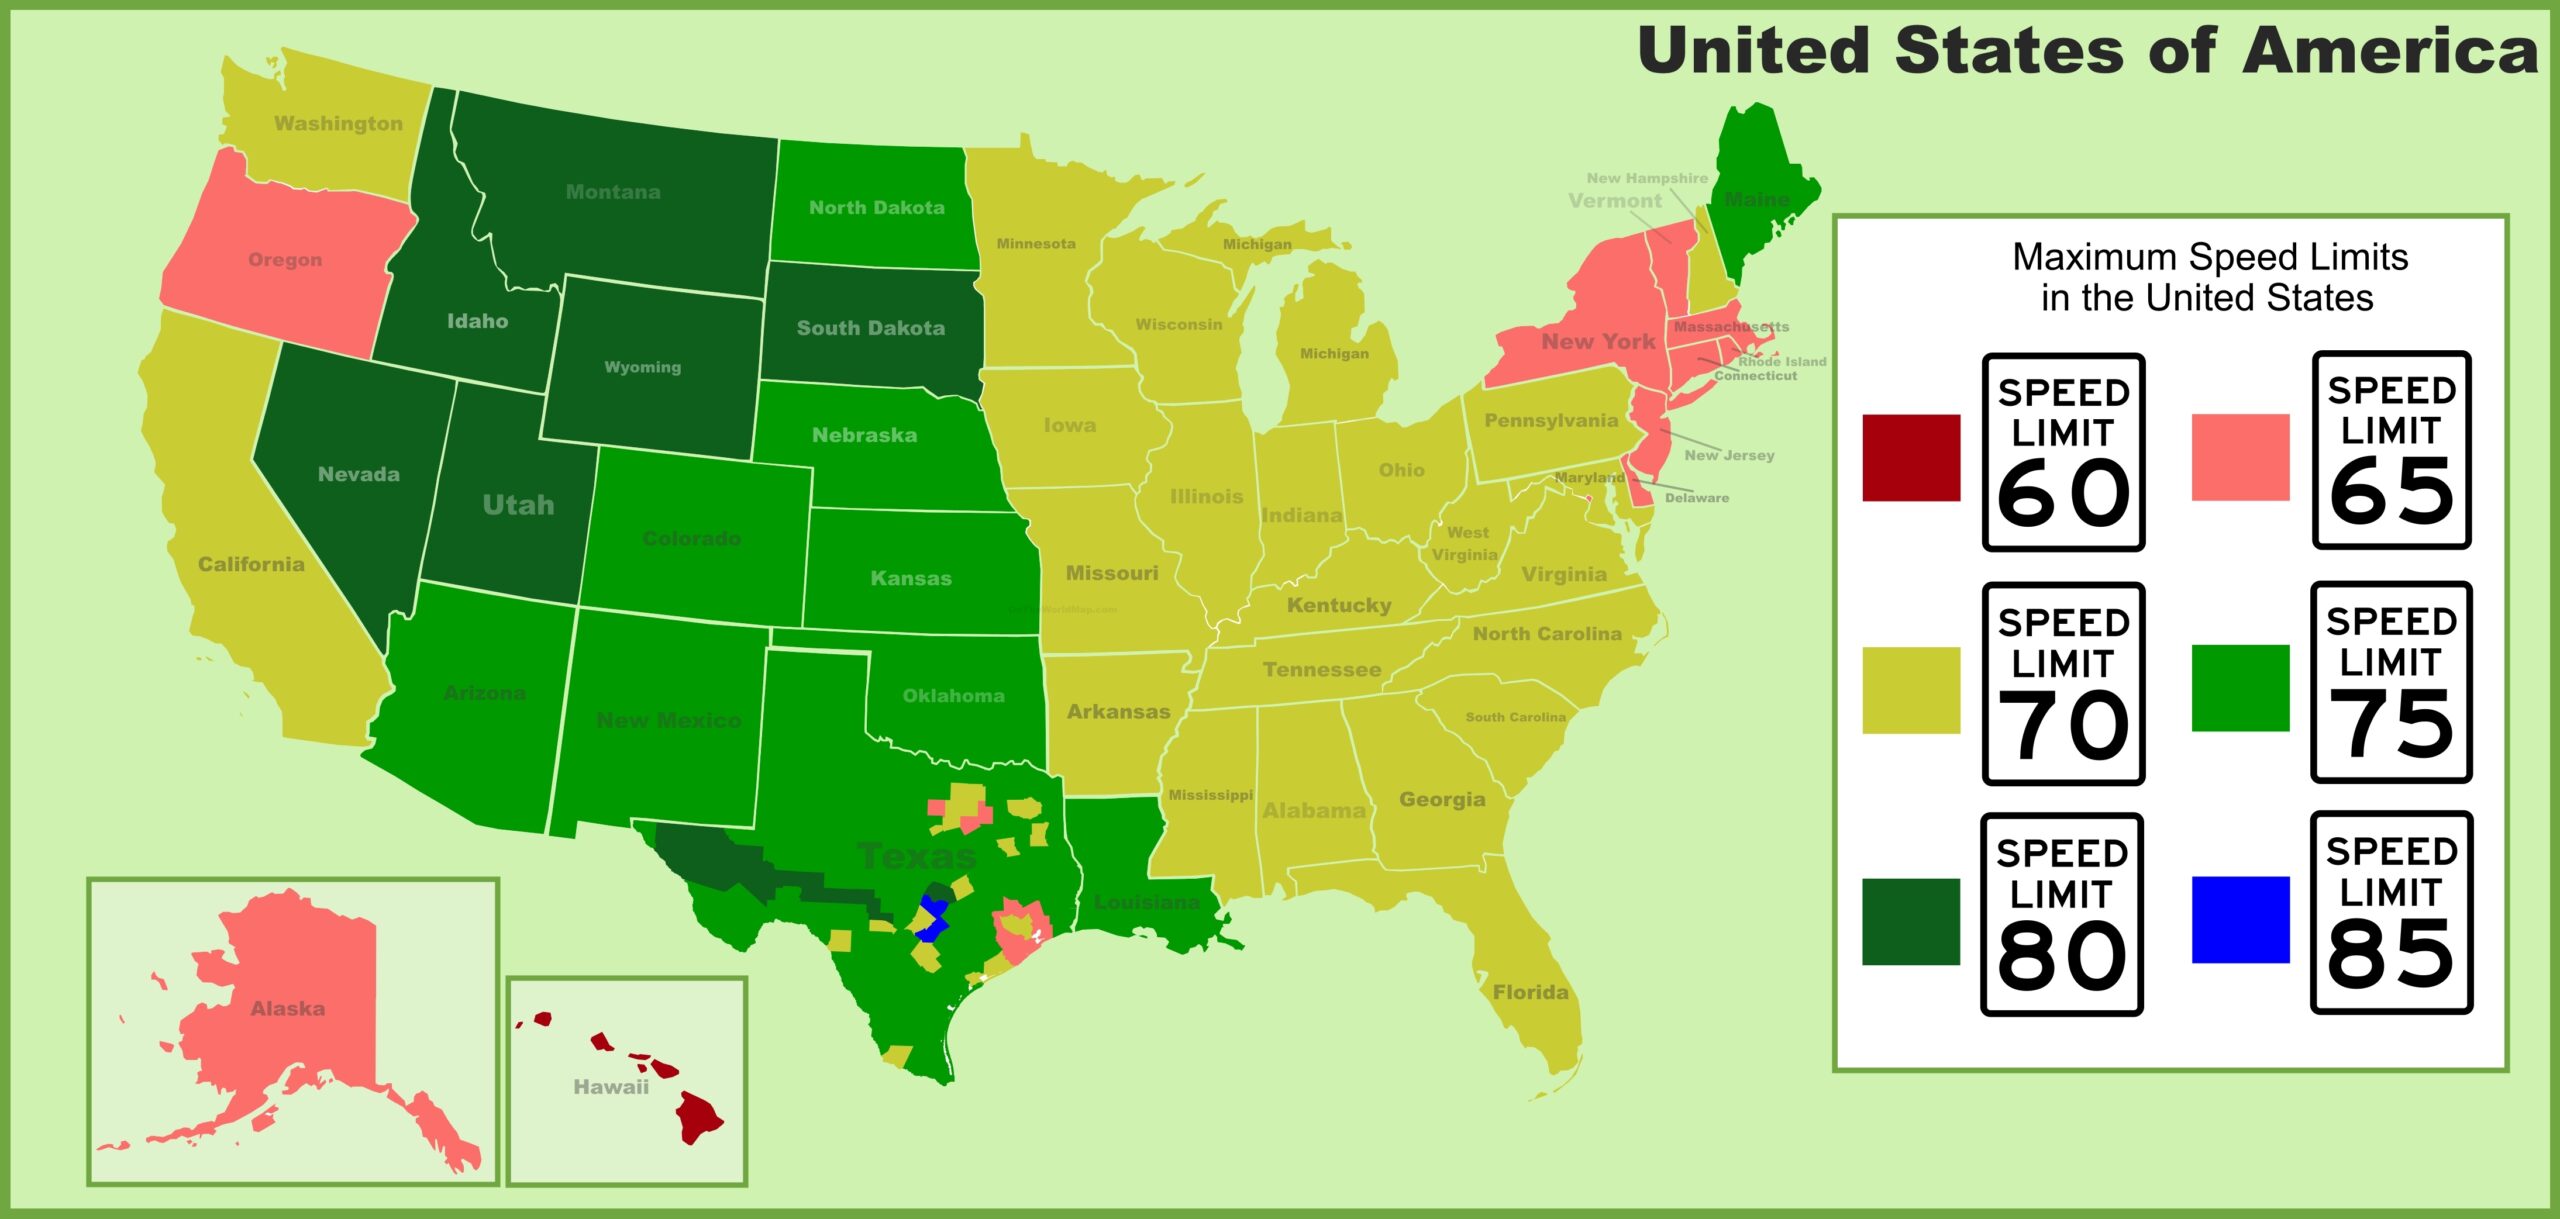
Imagine a colorful mosaic of the United States, where each state glows in shades of green, yellow, red, and blue, signaling the maximum speeds you can legally drive on its highways and byways. This USA-Speed-Limits-Map reveals the diverse speed limits across all 50 states, from Oregon’s 65 mph (pink) to Texas’s 85 mph (blue) on certain rural roads, stretching from Alaska’s remote paths to Florida’s sunny interstates. Whether you’re a road trip planner aiming to optimize your journey, a truck driver ensuring compliance, or a geography enthusiast intrigued by regional driving regulations, this map offers a detailed guide to America’s speed laws. Let’s explore its vibrant zones, uncovering the practical tips, historical context, and regional quirks that shape safe driving across the nation as of 2025!
USA-Speed-Limits-Map Insights
Decoding America’s Speed Limit Variances
This insightful USA-Speed-Limits-Map uses a spectrum of colors to highlight maximum speed limits on U.S. highways: red for 60 mph (e.g., Maine), pink for 65 mph (e.g., Oregon), yellow for 70 mph (e.g., Ohio), green for 75 mph (e.g., Colorado), dark green for 80 mph (e.g., Montana), and blue for 85 mph (e.g., parts of Texas). It spans from Washington’s 70 mph (yellow) in the Northwest to Florida’s 70 mph (yellow) in the Southeast, with insets for Alaska (65 mph, pink) and Hawaii (60 mph, red). The map’s clean design shows state boundaries and neighboring regions like Canada and Mexico, providing a clear, visual tool for drivers, law enforcement, and planners to navigate America’s varied speed regulations as of 2025, ensuring safety and efficiency on every road.
Essential Tools for Drivers, Regulators, and Educators
Road trippers and truck drivers use this map to plan routes, adjusting speeds for states like Nevada (75 mph, green) or New York (65 mph, pink) to stay within legal limits, avoiding fines or accidents. State transportation departments reference it to enforce and update speed laws, while insurance companies analyze it for risk assessment. Educators teach traffic safety and geography with its regional insights, and urban planners evaluate infrastructure to support higher speeds on rural interstates like those in Idaho (80 mph, dark green). This map serves as a critical resource for anyone navigating U.S. roads, promoting safety, compliance, and informed travel decisions across the nation as of 2025, with its detailed color-coding fostering awareness and responsibility.
Fascinating Stories of America’s Speed Laws
Did you know U.S. speed limits evolved dramatically, starting with the 55 mph national maximum during the 1970s oil crisis, then rising as states regained control in the 1990s? This USA-Speed-Limits-Map reflects that history, showcasing Texas’s pioneering 85 mph limit on rural toll roads (blue) since 2011, Montana’s 80 mph rural highways (dark green) post-1999, and Maine’s conservative 60 mph (red) for safety. States like California (65 mph, pink) balance urban density with rural speeds, while rural areas like Wyoming (75 mph, green) prioritize efficiency. As of 2025, these limits reflect geographic, economic, and safety considerations, each color on the map telling a story of regional identity, legislative evolution, and the drive for safer, smarter roads across America.